How to compare price movements of multiple stocks using Technical Analysis?
1. Select Technical Analysis from the Tools menu.
2. Select symbol of your choice using the "Search Symbol" bar on top right corner of your screen.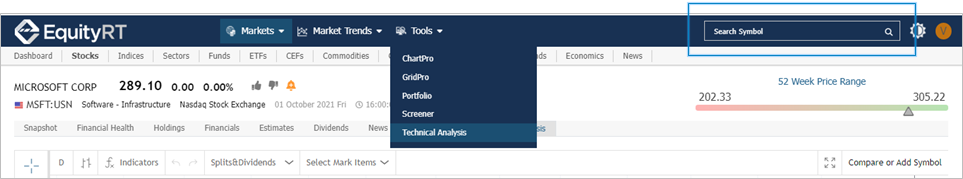
3. Once your chart has been plotted you can use the "Compare or Add Symbol" to make share price comparisons.
4. "Compare" will allow you to compare stocks on the same pane whilst the "Add" option will plot the next symbol on a different pane.
Related Articles
How do you overlay News in technical analysis?
1. Click on the "Select Mark Items" drop down option. 2. Select the "News" checkbox to overlay news headlines on your chart. 3. Click on the yellow news icon on the chart to read the news article. The news article can be copied and pasted using the ...
Can I compare economic indicators on a single chart?
Yes, you can do that. You can compare indicators that belong to a country or you can compare different countries for the same indicator. Let's compare "US Yearly Inflation Rate" with "Canada Yearly Inflation Rate". Please follow these steps: 1- Go to ...
How can I find popular stocks among fund managers?
1.Select "Fund Holding Trends" from "Holdings" menu. 2. Refine your analysis down to a sector level and see which are the popular stocks within a sector by clicking on "Sector" button from header menu of the page. 3. Select the sectors of your choice ...
How can I find popular stocks among Company Insiders?
1. Select "Insider Holding Trends" from "Market Trends" drop down menu. 2. Click the "Sector" button to refine your analysis down to a sector level. 3. Select from a wide range of sectors and sub-sectors and click 'OK'. TIP * To see the least ...
How do you setup a custom peer group of stocks in Financial Health?
1. Click the edit icon next to MyPeer. 2. Use the search bar to find and add the securities of your choice to your custom peer list. Remember to click Save. 3. You will now see the financial ratio medians of the securities in your custom "MyPeer" ...